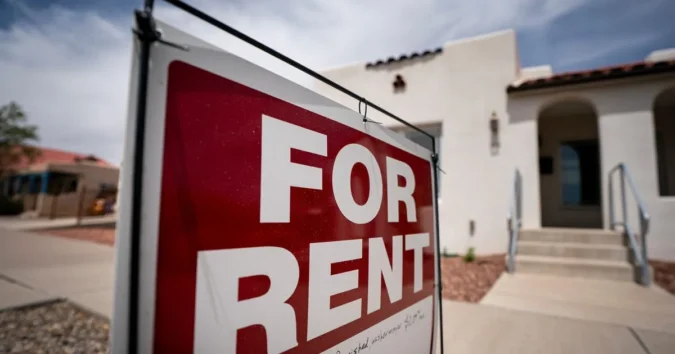
LOS ANGELES, CA — Renting stayed cheaper than buying in every major U.S. metro in August, according to a Zillow analysis of the 50 largest housing markets. The gap was wide enough to matter for households weighing whether to keep renting or take on the costs of ownership.
Zillow found the typical U.S. rent at $1,948 a month, while the typical new homeowner faced a monthly payment of $3,014 after mortgage costs, taxes and insurance. That leaves renters ahead by $1,066 a month, or $12,792 over a year.
The comparison also showed that buying generally required a higher income. Zillow said a household would need about $77,919 a year to afford the typical rental, while the income needed for a typical mortgage with 10% down was more than $120,500.
Zillow Says the Gap Held Across All 50 Major Metros
The company’s analysis did not find a single major metro where the typical rent topped the typical cost of buying a home. That means the cost advantage for renting was not confined to one region, one coast or one price tier.
Zillow compared households with similar incomes and assumed the buyer put 10% down on a home with a fixed-rate 30-year mortgage. The ownership side also included property taxes, insurance and closing costs at both purchase and sale.
On the renter side, the company counted monthly rent and renter’s insurance. That makes the comparison a practical look at the monthly cash flow many households consider first when deciding whether to rent or buy.
The Biggest Savings Show Up in California’s Costliest Markets
The largest monthly savings were concentrated in expensive coastal metros. San Jose led the country, where renters saved an average of $7,883 a month, or $94,596 a year, compared with buyers.
San Francisco followed at $5,413 a month in savings, then Los Angeles at $4,441 and San Diego at $4,235. Zillow also listed Seattle among the cities where annual savings from renting were the largest.
Those figures help explain why the rent-versus-buy decision can look very different from one city to the next. In markets with high home prices, the monthly burden of ownership can rise far faster than the cost of renting.
High Rents Still Leave New York, Miami and Los Angeles Among the Least Affordable
Even though renting was cheaper than buying, some metro areas still ranked as difficult places for renters. New York was the least affordable rental market in Zillow’s list at 40.6%, followed by Miami at 36.9%.
Los Angeles came next at 34.0%, with Riverside at 31.2% and San Diego at 30.5%. Those percentages show that lower cost than buying does not necessarily mean low cost overall for households trying to keep up with housing payments.
At the other end of the list, the most affordable rental markets were Austin, Raleigh and Salt Lake City at 18.3% each, followed by Minneapolis at 19.7% and St. Louis at 19.8%.
Rent Prices Are Up, But Ownership Costs Rose Faster
Zillow said typical U.S. rent rose 2.5% from a year earlier. Even so, the monthly cost of buying increased more quickly, keeping renters ahead on the monthly budget side of the ledger.
The report also said rents have climbed 38.5% since the start of the pandemic. That rise has made housing more expensive for renters, but the same period has also brought steep increases in the cost of homeownership.
The trend matters for households trying to decide whether to move from renting into buying, especially in markets where savings from ownership are not yet large enough to offset the higher upfront and monthly costs.
What Zillow Says Matters Most When Choosing Whether to Rent or Buy
Zillow said renting may offer a financial edge for people planning to stay in a home for five years or less. The company also noted that the best choice depends on more than monthly payment alone.
Flexibility, maintenance costs and the stability that comes with owning a home can all shape the decision. A lower rent payment may help cash flow, while ownership can still appeal to households focused on long-term stability.
The analysis was based on Zillow’s August rent report, which compared housing costs across 50 of the largest U.S. metro areas. The company’s calculations are meant to show how the math changes depending on where a household lives and how long it plans to stay.
More on what homes, rents and new builds are doing near you, on RHS Commoner.
